Learn the process
Use the Monitor Dashboard to view your research results, open science…
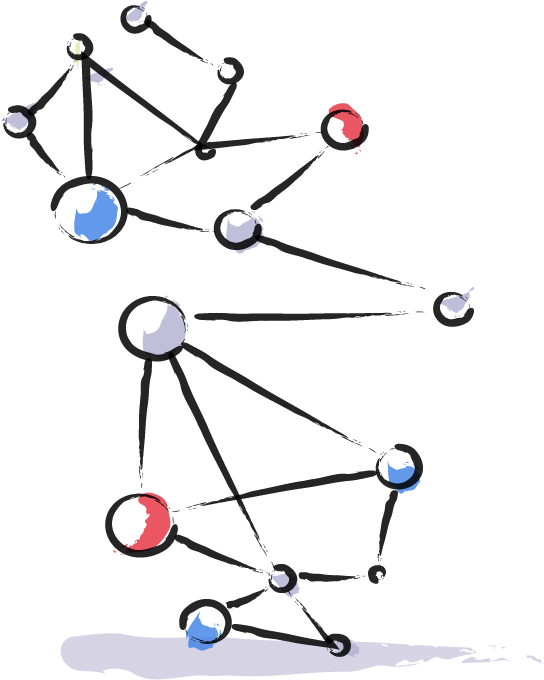
0. Starting from the OpenAIRE RESEARCH GRAPH
OpenAIRE Research Graph aggregates
a collection of research data properties for funders, organizations,
researchers, research communities and publishers to interlink information by using a semantic graph
database approach.

1. Provide us some information
You give us some simple (meta)data related to your organization function: e.g., funding database,
repositories, related projects, registry of people… All under confidential agreements.

2. We get the ball rolling
We ingest your data in our system and start the work: we clean and normalize your data, we identify and
extract related information, we infer links. We refine until we are happy of the results and present to
you.

3. You validate
After the first iteration you examine our results to ensure you are satisfied with what you see. As
numbers are important, we advise you to take your time and tell us of any deviations. We correct, you
check, you approve.

4. You set up your portal
Using our admin panel you set up your portal. You decide what metrics are of interest to you (full
documentation available). You decide what you want to publish, what to keep private, what to share with
colleagues.
5. You track, monitor, report
Now your views are updated every two weeks, as new content and new providers join OpenAIRE. You are
notified about new metrics and indicators as we keep on enriching the OpenAIRE Research Graph and you may
add them as they come along.